Using cohort analysis to fix misleading product metrics
Why mixing users in your North Star (product) metric can be a bad idea

Content
The Problem
- The Boring North Star Metric
- The Challenge with Creating a Good Metric
- How North Star Metric Turns Bad: Mixing Users in the Denominator
Cohort Analysis Deepdive
Toward a More Holistic Approach
- Alternative Approach 1: Simple Composite Metric (an Okay Approach)
- Alternative Approach 2: Replace your North Start metric with (shocking!) Two or More Metrics
- Overall Approach: Holistic Business Views
- Beyond Cohort: Other Confounding Factors
The Boring North Star Metric
After spending time defining and tracking metrics to monitor your product health, it can be discouraging to look at your dashboard every month and never find anything useful.
Many Product North Star metrics look something like the chart below - kinda random most of the time.
If you are lucky, your Monthly Active Users metric may go up in the same month you release that new widget, and everyone celebrates!
Until it drops again.
And someone will promise to monitor and see if there’s a reversal next month. But we all know it probably will go up again, and no further action is needed.

Did we improve the product or not?
This situation is so common, it can lead to a declining interest in being data-driven. Worse, data may then be used just to justify, rather than inform decisions.
The Challenge with Creating a Good Metric
You most likely have come across these advices on designing metrics:
- Avoid vanity metrics (page views, number of active users, etc.).
- Embrace ratio metrics (MAU, MEU, etc.).
- Embrace a single North Star Metric that your organisation or team can all get behind.
These advices usually culminate into a ratio metric like “% of Logged in Users”, “% of Engaged Users” or “% User Making a Repeat Purchase”.
While there is a solid foundation for these principles, simply following them can still lead to misleading and useless metrics.
One common issue with these ineffective metrics is mixing users from different cohorts in the denominator.
I will discuss this problem, and Cohort Analysis - the recommended method to deal with this problem in detail.
How North Star Metric Turns Bad: Mixing Users in the Denominator
Let’s say you defined a metric called Engaged Users % which is the % of users over all paid users who interact with your app in a meaningful way, i.e. not just logging in.
In Table 1, you can see when users join the app, and whether they are engaged in each month following their signup.
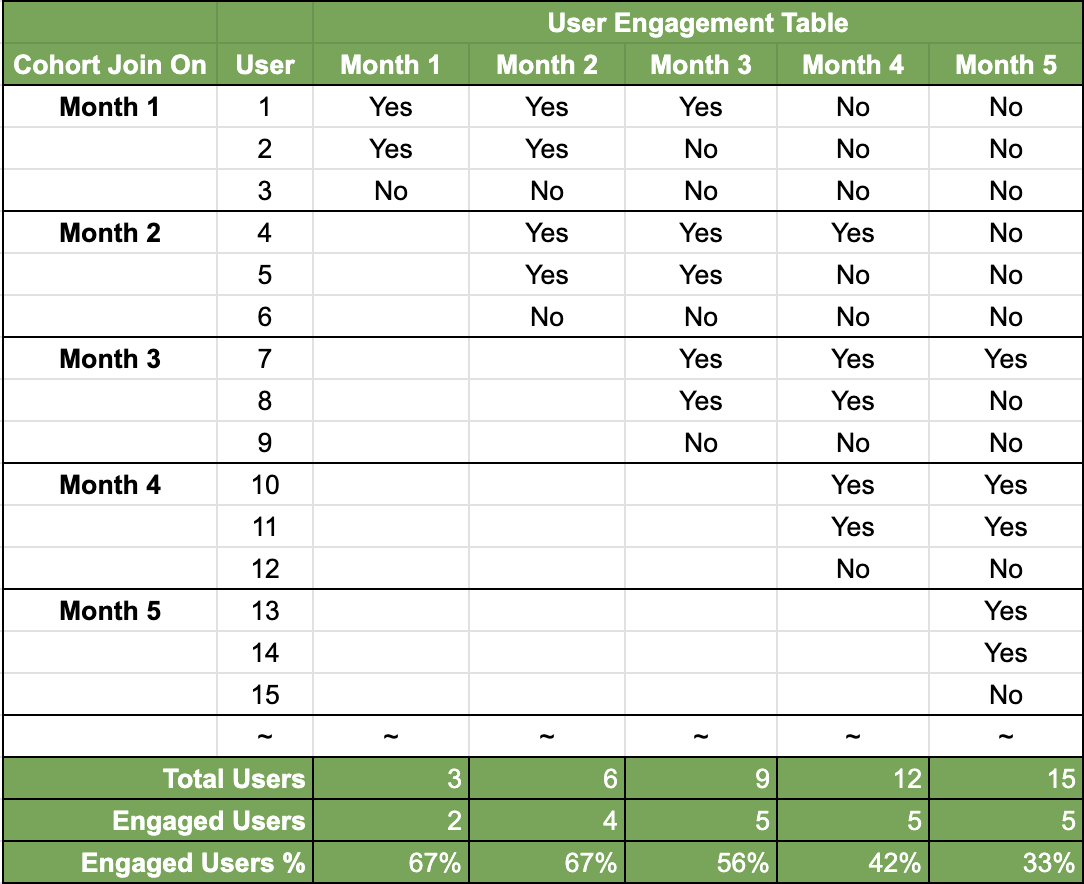
Table 1: an example of calculating Engaged Users % metric
The first three rows include users who join in Month 1. The first user engaged with the app in the first three months (where there’s a “yes”) then stopped, the second user engaged for two months then stopped, and the third user signed up but never engaged.
The subsequent cohorts who joined in months 2, 3, and so on, each also include three users who behave the same way - the first user engaged for three months then stop, the second engaged for two months then stop, etc.
The notable pattern here is there’s no change between the behaviours of users in each cohort. We do not show the data beyond month 5, but this pattern repeats.
Now, if we try to calculate the Engaged Users % metric in this example, it will start to drop from month 2. But there was no change in how each new user group behaves compared to the last!
That’s the insidious consequence of mixing user cohorts in the denominator. After some time, your new users become old users and become more disengaged (even though they may still have a subscription). This increasing proportion of old users can hurt your overall Engagement Metric.
Even if you improve your product, the above situation may mask that improvement and you may wrongly conclude that there was no engagement uplift.
The gold standard for product impact assessment is causal inference with experimentation. But the reality is not many organisations have the necessary process and capacity to run experiments regularly.
Therefore, we turn to Cohort Analysis to find more meaningful signals from the user engagement data like in Table 1.
Cohort Analysis View 1: The Marketing View
Table 2 shows the Engaged Users % for each cohort over time. This is readily available in many analytics or billing software.

Table 2: Marketing View: Cohorted Engaged Users %
This view is great at showing you the gradual change in the behaviours of user groups who joined at different times. It is great for checking the impact of marketing and promotion campaigns. What you need to do is to look at the cohort who joined at the time the campaign was run.
However, what if you still want to see the performance of your product over time in terms of user engagement?
Cohort Analysis View 2: The Product View
Another way to present the same information is shown in Table 3.
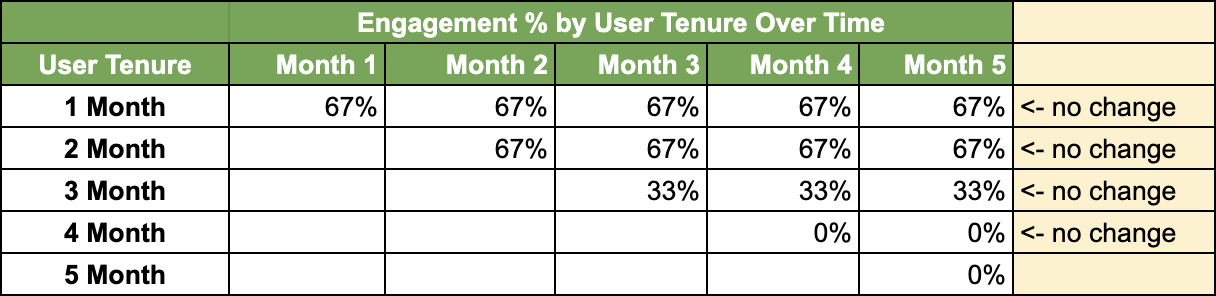
Table 3: Product View: Cohorted Engaged Users %
In this view, each row represents the metric for users by their tenure (months from signup). The first row, for instance, shows us that over five months, new users (those who have been on the app for one month or less) always engage with the app at the same rate.
It now is easier to see the engagement change over time for users of similar tenure. An example is shown in Table 4 where a new onboarding process introduced in Month 4 leads to an engagement uplift for new users.

Table 4: A change in new (one-month-tenured) users due to a product change in month 4.
While Cohort Analysis is the suggested approach by many data and product practitioners, it has one major flaw - information overload.
Except in very data-matured organisations, an analyst would find it difficult to convince business stakeholders to review these cohort matrices with any regularity.
For that reason, let’s look at a few other more digestible options.
Alternative Approach 1: Simple Composite Metric (an Okay Approach)
Recall that the problem with mixing all users in the denominator is the changing size of the mixed cohorts: in the beginning, you only have highly engaged, new users, while after a few years, many of your users become less engaged, old users.
Cohort Analysis addresses this, but it causes information overload. So another option is to remove the effect of cohort sizes - by calculating the metric for each cohort separately and taking the (non-weighted) average (Table 5).

Table 5: Taking a non-weighted average of the Engaged Users % for all cohorts.
As can be seen in the last row, this approach yields a composite metric that reflects the average engagement across all user tenures (from 1 month to 12 months).
The downside of this is that you almost always want to split it out again anyway when you observe a change. Your stakeholders would want to understand if the decrease/increase is attributed to the new or older cohort.
While I do not like this approach a lot, it’s still a way to succinctly describe and track a single product metric, in the spirit of the North Star ideals.
Alternative Approach 2: Replace your North Start metric with (shocking!) Two or More Metrics
This is a middle-of-the-road approach. Instead of having one composite metric, or technically having many if you use Cohort Analysis, you can have, say, two metrics for two distinct groups of users.
One metric can be New User Engagement which is the % of engaged users in their first 7 days after signup.
The second metric can be Pre-renewal Engagement which is the % of engaged users 28 days before renewal.
This allows you to separate two distinct groups of users and optimize your onboarding and re-engagement experience.
Each metric also acts as a guardrail metric for the other. If you implement a pop-up user tutorial, does it improve New User Engagement while annoying old users and driving down Pre-renewal Engagement?
In some companies, there might be two Product Teams looking after these two experiences, and it makes sense that they would try to optimise a different metric while ensuring that the other is not impacted.
This is currently my preferred approach. But check back with me in a year, I might have changed my mind then!
Overall Approach: Holistic Business Views
From my experience, a Product team really should understands and tracks several metrics which together provide a holistic business view.
The topic warrants a separate post, but I will briefly outline my thoughts here.
There are three types of Metrics that a Product team should always pay attention to, regardless of what their current OKR’s might be:
- Growth Metrics: this is especially crucial during the early stage of your product. You may sacrifice Retention Rate and User Engagement as long as your User Growth outpaces your Attrition.
- Retention Metrics: this becomes more important later as your growth slows down and your product becomes more mature.
- Engagement Metrics: this is mostly what we talked about in this article. Engagement is a good leading indicator for Retention.
Examining these in tandem gives you a more complete picture of your revenue source, leak (via churn), and a leading indicator (engagement) of future performance (growth and retention).
Beyond Cohort: Other Confounding Factors
So far we mainly talked about the difference in behaviour between users of different tenures, but it’s certainly not the only delineation.
For example, due to a recent expansion, you start to have more users from a certain country, but these users have a higher engagement rate than your normal user base.
This leads to a higher Engaged Users % number since the expansion, and can make us mistakingly attribute the positive change to something else.
Unfortunately, it’s very hard to split the users across all possible delineations.
The good news is as long as the demographics of your users are relatively stable, most of the time you only need to care about user age on the platform.
Final Remarks
While the idea of a ratio-based North Star metric has helped tech companies identify and track meaningful success metrics, a fundamental understanding of basic analysis techniques like Cohort Analysis is still paramount.
I advocate for a more holistic approach where each team, in addition to optimising their dedicated Product Metric, should always keep an eye on the company’s Growth and Retention metric, both as guardrail metrics and as auxiliary goals they try to improve.